
Introduction
Businesses collect data from websites, customer relationship management systems, sales platforms, financial records, applications, and many other sources. However, collecting information is only the first step. To make useful decisions, organizations need data that is accurate, organized, accessible, and efficient to process.
Data optimization tools help businesses improve how they collect, clean, transform, store, process, and analyze information. Depending on the software, these tools can remove duplicate records, validate data quality, improve database performance, automate data pipelines, reduce unnecessary storage, or prepare information for reports.
The right solution depends on your goal. A small business preparing spreadsheets may need a simple data preparation tool, while a data engineering team managing millions of records may require automated pipelines, data quality monitoring, and database performance tools.
This guide explains the main types of data optimization software, compares useful options, highlights their limitations, and provides a practical method for choosing a solution that fits your needs.
What Are Data Optimization Tools?
Data optimization tools are software applications and technologies that improve the quality, structure, performance, or usability of data.
They help turn raw information into something more reliable and useful. For example, a business may have customer records with inconsistent phone numbers, repeated email addresses, missing locations, and different date formats. A data optimization tool can help standardize these records, identify duplicates, and prepare the information for analysis.
Other tools focus on technical performance. They may help database administrators examine slow queries, reduce unnecessary data processing, improve indexing strategies, or organize large datasets for faster access.
Data optimization is therefore a broad category rather than a single type of software.
Common goals include:
- Improving data accuracy and consistency.
- Identifying missing, duplicated, or invalid records.
- Combining information from multiple sources.
- Automating repetitive data preparation tasks.
- Improving database query performance.
- Reducing storage and computing costs.
- Making data easier to analyze and report.
- Monitoring data quality over time.
The best results usually come from combining suitable tools with clear data standards and regular monitoring.
Best Data Optimization Tools to Consider
Different tools solve different problems. The following options cover data preparation, transformation, quality management, analytics, and database performance.
1. Microsoft Power Query
Microsoft Power Query is a data preparation and transformation technology available in products such as Excel and Power BI.
It allows users to connect to data sources and apply repeatable transformation steps through a graphical interface. Common tasks include removing unwanted columns, filtering rows, changing data types, merging tables, grouping records, and reshaping datasets.
Best for: Spreadsheet users, business analysts, and teams preparing data for reports.
Key features:
- Connects to supported data sources.
- Cleans and reshapes tables.
- Combines information from different sources.
- Records transformation steps for reuse.
- Supports repeatable data preparation workflows.
Example: A retailer receives separate sales spreadsheets from several branches. Power Query can help combine those files, standardize column names, remove unnecessary fields, and prepare the results for a sales dashboard.
Limitations: It is not a complete replacement for enterprise data governance, advanced database administration, or every large-scale data engineering platform. Capabilities also depend on the host product and data source.
Official resource: Microsoft Power Query documentation.
2. dbt
dbt is a data transformation platform used to build and manage analytical data models with SQL and related development workflows.
It is particularly useful when an organization stores information in a data warehouse and needs consistent, maintainable transformations. Teams can organize transformation logic, document models, and test assumptions about the resulting data.
Its data tests can check conditions such as whether a field contains unique values, whether required values are missing, or whether relationships between datasets remain valid.
Best for: Analytics engineers, SQL developers, and teams managing data warehouse transformations.
Key features:
- SQL-based data transformation workflows.
- Reusable and organized data models.
- Data tests for important business rules.
- Documentation and development practices.
- Support for controlled changes to analytical datasets.
Example: An online store wants to combine customer, order, and payment information into a consistent reporting model. dbt can help transform those source tables and test whether order identifiers are unique and required customer references are present.
Limitations: dbt is not a universal point-and-click cleaning tool. Users generally need SQL and an appropriate supported data platform. Available capabilities depend on the dbt product, edition, and connected technology.
Official resource: dbt data tests documentation.
3. AWS Glue Data Quality
AWS Glue Data Quality helps organizations evaluate and monitor the quality of datasets used in supported AWS data environments.
It allows teams to define rules that check data against expected conditions. These may cover completeness, uniqueness, consistency, valid values, and other requirements. The service can also recommend potential rules and help identify records that fail checks in supported workflows.
Best for: Organizations already using AWS Glue, data lakes, and AWS-based data pipelines.
Key features:
- Configurable data quality rules.
- Rule recommendations for supported datasets.
- Quality evaluations and results.
- Detection of certain data anomalies.
- Integration with supported data processing and monitoring workflows.
Example: A company imports transaction records every night. It can create checks for missing transaction IDs, unexpected values, or duplicate records and investigate failures before relying on the data for reporting.
Limitations: AWS Glue Data Quality is designed for compatible AWS workflows, not every data environment. Setup, permissions, supported sources, and usage charges should be reviewed before adoption.
Official resource: AWS Glue Data Quality documentation.
4. Apache Spark
Apache Spark is an open-source engine for processing large datasets across computing resources. It supports distributed data processing and provides SQL and DataFrame capabilities.
Spark can help teams transform, filter, aggregate, and analyze datasets that may be too demanding for simple spreadsheet workflows. Performance tuning can involve caching, partitioning, selecting suitable join strategies, and examining execution plans.
Best for: Data engineers, developers, and organizations processing large datasets.
Key features:
- Distributed data processing.
- SQL and DataFrame operations.
- Batch processing and supported streaming workloads.
- Integration with many data storage systems.
- Performance tuning options for supported workloads.
Example: A delivery business needs to process millions of shipment records to calculate delivery times by region. Spark can distribute the processing workload and produce aggregated results for further analysis.
Limitations: Spark may require technical expertise, infrastructure planning, and monitoring. It can be excessive for small datasets, and distributed processing does not automatically make every job faster or cheaper.
Official resource: Apache Spark SQL performance tuning.
5. PostgreSQL Query Analysis Tools
PostgreSQL includes built-in tools for examining how SQL queries are executed. The EXPLAIN command shows the query plan selected by the database planner, while EXPLAIN ANALYZE executes the query and reports actual execution information.
These features help developers investigate slow queries and understand whether the database is scanning tables, using indexes, sorting results, or performing joins.
Best for: Database administrators, developers, and businesses using PostgreSQL.
Key features:
- Query execution plan inspection.
- Estimated and actual execution details.
- Investigation of table scans and index usage.
- Support for performance troubleshooting.
- Evidence for evaluating query changes.
Example: A reporting query takes several seconds to retrieve recent orders. A developer can inspect its execution plan, check the filtering conditions, and evaluate whether an index or a query rewrite is appropriate.
Limitations: Query plans require interpretation. Adding indexes without understanding the workload can increase storage needs and slow some write operations. A change that improves one query may not improve the whole application.
Official resource: PostgreSQL EXPLAIN documentation.
Quick Comparison of Data Optimization Software
| Tool | Main purpose | Ideal user | Technical level |
|---|---|---|---|
| Microsoft Power Query | Data preparation and transformation | Analysts and spreadsheet users | Beginner to intermediate |
| dbt | SQL transformations and data testing | Analytics engineers | Intermediate to advanced |
| AWS Glue Data Quality | Data quality monitoring | AWS data teams | Intermediate to advanced |
| Apache Spark | Large-scale data processing | Data engineers and developers | Intermediate to advanced |
| PostgreSQL EXPLAIN | Database query analysis | Database administrators and developers | Intermediate to advanced |
This comparison focuses on each tool’s main role, not an overall ranking. These tools are not direct substitutes for one another. A business might use Power Query for initial preparation, dbt for warehouse transformations, and database performance tools to investigate slow queries.
Main Types of Data Optimization Tools
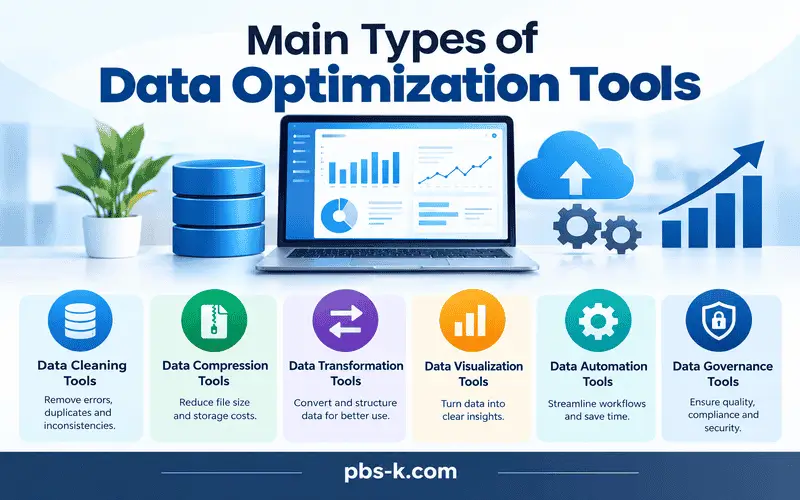
Understanding the different categories makes it easier to select software based on a specific problem rather than a popular product name.
Data Cleaning and Preparation Tools
Data cleaning software identifies and helps correct problems in raw datasets. These problems may include missing values, inconsistent formatting, invalid entries, repeated records, and unnecessary fields.
For example, a customer database may contain the same person several times because one record uses a full name while another uses an abbreviation. A cleaning workflow can standardize names and flag potential duplicates for review.
Useful capabilities include:
- Removing exact duplicate records.
- Standardizing dates, phone numbers, and text fields.
- Identifying missing values.
- Detecting invalid or unexpected entries.
- Applying consistent formats to columns.
- Reviewing potential duplicates before merging records.
Not every duplicate is an error. Two customers may share a name, address, or family email account. For this reason, automatic deletion should be based on carefully chosen rules.
Data Integration and ETL Tools
Data integration tools combine information from different systems. Many support ETL, which stands for extract, transform, and load.
ETL workflows extract data from source systems, transform it into a suitable format, and load it into a destination. ELT, or extract, load, and transform, loads data first and performs transformations within the destination environment.
These tools are useful when a business relies on several systems that do not share a common data structure.
For example, an online retailer may need to combine website orders, inventory records, customer support tickets, and marketing campaign data. An integration workflow can bring supported sources together and make the information available for reporting.
When comparing ETL software, review connector availability, scheduling, error handling, monitoring, data volume limits, and pricing.
Data Quality and Validation Tools
Data quality tools check whether information meets defined standards. Instead of simply cleaning a dataset once, they can help organizations detect new problems as data enters a system.
A company might establish rules requiring every order to have an order ID, every transaction to contain a valid date, and every customer reference to match an existing customer record.
Important features include:
- Completeness checks.
- Uniqueness validation.
- Data type and format checks.
- Referential integrity checks.
- Business-rule validation.
- Alerts and quality reports.
- Historical monitoring of recurring problems.
These tools are especially useful when data feeds business dashboards, financial reporting, inventory systems, or operational decisions.
A passing validation result does not prove that every record is correct. Rules must reflect the real business requirements, and unexpected issues may still require manual investigation.
Database Performance Optimization Tools
Database optimization software helps identify and resolve problems that affect how quickly a database retrieves, updates, or processes information.
Depending on the database system, optimization work may involve reviewing query execution plans, checking slow queries, adjusting indexes, improving SQL statements, and evaluating database resource usage.
Common techniques include:
- Query analysis and performance profiling.
- Index evaluation.
- Query rewriting.
- Table and partition design.
- Statistics maintenance.
- Connection and resource monitoring.
For example, a dashboard that loads slowly may repeatedly request unnecessary columns or join large tables inefficiently. Examining the query plan can help reveal where the work is occurring.
Database optimization should be measured rather than based on assumptions. More indexes, additional caching, or larger servers are not automatically the best solution.
Data Analytics and Business Intelligence Tools
Analytics and business intelligence tools turn prepared data into reports, charts, dashboards, and business insights.
They are most useful after the underlying data has been collected, checked, and organized. Some platforms also include data preparation features, but their main purpose is to help users explore information and communicate results.
Businesses may use analytics tools to monitor sales, compare marketing campaigns, review customer retention, track inventory, or measure operational performance.
A well-designed dashboard should use clear definitions and trustworthy data. A visually attractive report cannot compensate for missing records, incorrect calculations, or inconsistent source information.
Storage and Big Data Optimization Tools
Storage and big data optimization focuses on handling large datasets efficiently. Techniques may include compression, columnar storage formats, partitioning, caching, and reducing unnecessary data movement.
The right approach depends on the data format, workload, storage system, and access pattern.
For example, a team that repeatedly analyzes a large historical dataset may benefit from a storage format and partition strategy suited to its queries. However, a design that speeds up one type of query may make other queries less efficient.
Teams should measure storage consumption, processing time, data retrieval speed, and ongoing infrastructure costs before deciding whether a change is worthwhile.
Key Benefits of Data Optimization Tools
The benefits depend on the selected software and how it is implemented. When tools address a real problem, they can improve several parts of a data workflow.
Improved Data Accuracy
Validation and cleaning workflows can help detect missing information, duplicates, inconsistent formats, and invalid values. More consistent data gives teams a stronger foundation for analysis.
Accuracy still depends on source information and the rules used to check it. A system cannot reliably correct every mistake without suitable context.
Faster Data Processing
Performance tuning, appropriate data structures, and efficient transformations can reduce unnecessary processing.
For example, a query that retrieves only the columns needed for a report may do less work than one that retrieves every column. The actual improvement depends on the database, query plan, dataset size, and system resources.
Better Business Decisions
Reliable information helps managers compare results, understand changes, and evaluate possible actions.
Sales teams can use consistent customer records, while operations teams can compare inventory and order data. The value comes from making the information trustworthy and relevant to the decision.
Reduced Manual Work
Repeatable transformations and scheduled quality checks can reduce the need to fix the same data problems manually every day.
Automation is particularly useful for recurring reports and data imports. However, workflows still need monitoring, maintenance, and a process for handling unexpected errors.
More Efficient Resource Usage
Some optimization methods reduce storage requirements, avoid unnecessary computations, or improve resource allocation.
These changes may lower operating costs, but savings are not guaranteed. A new platform can introduce licensing, infrastructure, training, and maintenance expenses of its own.
More Consistent Reporting
When teams use common definitions and transformation rules, they are less likely to produce conflicting reports from the same source data.
A shared definition of an active customer, for instance, can help different departments calculate the same metric consistently.
How to Choose the Right Data Optimization Tool
Choosing suitable software starts with the problem you need to solve. A product with many features is not necessarily the right choice if your team only needs to clean a spreadsheet or investigate a slow query.
Step 1: Identify Your Main Data Problem
Write down the issue you want to address before comparing vendors.
Ask yourself:
- Is the data incomplete, inconsistent, or duplicated?
- Do you need to combine multiple sources?
- Are reports slow or unreliable?
- Does a database query take too long?
- Are storage or cloud processing costs increasing?
- Do you need to monitor data quality automatically?
Choose a tool category that directly addresses the main problem.
Step 2: Evaluate Your Data Sources
Check where your data currently lives. It might be stored in spreadsheets, relational databases, cloud warehouses, applications, CSV files, or data lakes.
Confirm that a potential tool supports your required sources, formats, authentication methods, and destinations.
A tool with a long connector list may still lack support for a particular source or feature that your workflow depends on.
Step 3: Match the Tool to Your Team’s Skills
A visual data preparation tool may be easier for a nontechnical team than a code-based data engineering platform.
On the other hand, developers managing complex transformations may prefer SQL, version control, automated testing, and programmable workflows.
Consider training requirements, documentation, maintenance responsibilities, and who will troubleshoot problems after deployment.
Step 4: Compare Features and Integration
List the features that are essential rather than treating every available function as equally important.
For example, a business automating nightly imports may prioritize scheduling, retry handling, monitoring, and alerts. A database administrator may focus on execution plans, query statistics, and resource metrics.
Also check whether the tool integrates with your existing reporting, storage, security, and data governance systems.
Step 5: Review Pricing and Total Cost
The total cost may include more than the advertised subscription.
Depending on the product, expenses may involve:
- User licenses or subscriptions.
- Data processing and storage.
- Cloud infrastructure.
- Data transfer and API usage.
- Implementation and migration.
- Training and ongoing maintenance.
Compare expected costs under your actual workload. A free tool can be suitable for a small project, while a paid service may provide valuable automation or support for a larger operation.
Step 6: Test With a Representative Dataset
Before adopting a tool, use a small but realistic sample of your data.
Measure the current workflow and compare it with the proposed solution. Check whether the tool handles missing values, duplicates, unusual formats, large files, and expected data changes.
A pilot should test both normal operations and failure cases. For example, determine what happens when a required field is missing or a scheduled import fails.
Step 7: Measure Results After Implementation
Define success before deployment.
Useful measures include:
- Percentage of records passing validation.
- Number of duplicate records detected.
- Time required to prepare a report.
- Query execution time.
- Storage consumption.
- Processing cost per workflow.
- Number of failed data jobs.
- Time spent on manual corrections.
Compare these measures against the baseline. This helps you determine whether the tool is delivering practical value rather than simply adding another system to manage.
Practical Example: Optimizing Customer Data
Consider a small online store that maintains customer information in spreadsheets and imports orders from an e-commerce platform.
The store has three problems: duplicate customer records, inconsistent contact details, and slow monthly sales reports.
A practical optimization workflow could look like this:
1. Inspect the source data. Identify missing email addresses, inconsistent date formats, duplicate order IDs, and differences in column names.
2. Standardize the records. Use a data preparation tool to apply consistent formats, correct clear formatting issues, and flag possible duplicates.
3. Define validation rules. Require order IDs, check that dates are valid, and establish rules for customer references. Review exceptions instead of automatically deleting uncertain records.
4. Combine the sources. Use an appropriate integration or transformation workflow to connect customer information with order data.
5. Investigate report performance. If the monthly report remains slow, examine the database queries and identify unnecessary processing or inefficient joins.
6. Automate recurring checks. Schedule supported validation tasks and create alerts for failures that require attention.
7. Compare the results. Measure the time needed to prepare the report, the number of data issues found, and the frequency of failed imports.
The store does not necessarily need five separate enterprise platforms. It may only need a data preparation tool and a few well-defined checks. More advanced systems become useful when data volume, complexity, or monitoring needs justify them.
Common Data Optimization Mistakes to Avoid
Even capable software can produce poor results when it is configured without a clear plan.
Choosing a Tool Before Defining the Problem
A popular platform may not address your actual bottleneck. Determine whether the main issue involves data quality, integration, storage, or query performance before selecting a product.
Removing Data Without Reviewing It
Automatic deletion can remove legitimate records, particularly when matching rules are too broad. Keep backups, define duplicate criteria, and review uncertain matches before making permanent changes.
Ignoring Data Quality Rules
Cleaning data once does not prevent new problems from appearing. Use recurring checks where appropriate and assign responsibility for investigating failures.
Over-Optimizing Performance
Caching, indexes, partitions, and additional infrastructure can introduce costs and complexity. Measure the current performance first, make targeted changes, and test the results.
Overlooking Security and Privacy
Data optimization may involve moving sensitive information between systems. Check access permissions, encryption options, retention policies, contractual terms, and applicable privacy requirements.
Do not upload confidential customer or financial data to a third-party tool without reviewing its security and data-handling practices.
Ignoring Long-Term Maintenance
Automated workflows can break when source fields change, APIs are updated, credentials expire, or data volumes increase. Document the process, monitor failures, and establish an owner for ongoing maintenance.
Trusting Dashboards Without Checking the Source
A dashboard can display precise-looking numbers even when the underlying data is incomplete or outdated. Validate important metrics and document how they are calculated.
How to Measure Data Optimization Success
The right measurement depends on the problem being solved. Avoid relying on one general score to represent every aspect of data quality or performance.
| Goal | Suggested metric | What it tells you |
|---|---|---|
| Improve completeness | Percentage of required fields populated | Whether essential information is present |
| Reduce duplication | Number or rate of duplicate records | How often repeated records occur |
| Improve reliability | Percentage of validation checks passed | Whether defined data rules are met |
| Speed up reporting | Report runtime | How long reports take to finish |
| Improve query performance | Query execution time and resource usage | How efficiently queries run |
| Reduce storage | Storage used by a comparable dataset | Whether storage requirements have changed |
| Improve automation | Failed jobs and manual interventions | How reliably the workflow operates |
| Control costs | Cost per run or reporting cycle | Whether the process is becoming more economical |
Set a baseline before making changes. Then compare equivalent workloads under similar conditions.
For example, compare the same report over a similar dataset rather than comparing a small test file with a full production workload. Keep the quality of the output in view as well as speed. A faster process is not an improvement if it silently drops valid records.
Conclusion
Data optimization tools help organizations make information cleaner, easier to use, and more efficient to process. The right choice depends on whether you need data preparation, transformation, validation, large-scale processing, or database performance analysis.
Microsoft Power Query is a practical option for many spreadsheet and reporting workflows. dbt supports structured analytical transformations and testing, AWS Glue Data Quality helps monitor supported AWS datasets, Apache Spark handles large-scale processing, and PostgreSQL’s query analysis features help investigate database performance.
Start by identifying your biggest data problem, test a suitable tool against a representative dataset, and measure the results. A focused solution with clear rules and ongoing monitoring is often more useful than adopting a complex platform without a defined purpose.
FAQs
What Are the Best Data Optimization Tools?
The best tool depends on your objective. Microsoft Power Query is useful for data preparation, dbt supports SQL transformations and testing, AWS Glue Data Quality monitors supported datasets, Apache Spark processes large datasets, and PostgreSQL provides tools for query performance analysis.
Are Data Optimization Tools Free?
Some tools are open source or offer free versions, while others charge subscription fees or usage-based prices. Check licensing, processing limits, hosting costs, and premium features before choosing a solution.
How Do Data Optimization Tools Improve Data Quality?
They can identify missing values, duplicates, inconsistent formats, invalid records, and broken relationships between datasets. Results depend on the validation rules, source data, and the tool’s capabilities.
What Is the Difference Between Data Optimization and Data Cleaning?
Data cleaning focuses on identifying and correcting data quality problems. Data optimization is broader and may also include transformation, integration, storage efficiency, query performance, and processing improvements.
Which Data Optimization Tools Are Best for Beginners?
Beginners working with spreadsheets may find Microsoft Power Query accessible because it provides a graphical interface for common data preparation tasks. More advanced database and engineering tools generally require additional technical knowledge.
Can Data Optimization Tools Reduce Business Costs?
They may reduce manual work, unnecessary processing, storage consumption, or inefficient queries. However, actual savings depend on implementation, workload, licensing, infrastructure, and ongoing maintenance costs.
Are Data Optimization Tools Suitable for Small Businesses?
Yes. Small businesses can benefit from basic data preparation, duplicate detection, validation, and reporting tools. The best starting point is usually a simple solution that addresses a recurring problem without adding unnecessary complexity.
How Do I Measure the Success of Data Optimization?
Compare results against a baseline using relevant metrics, such as data quality pass rates, duplicate counts, report completion time, query runtime, storage usage, and cost per processing run. Evaluate accuracy and reliability alongside speed.